当前第2页 返回上一页
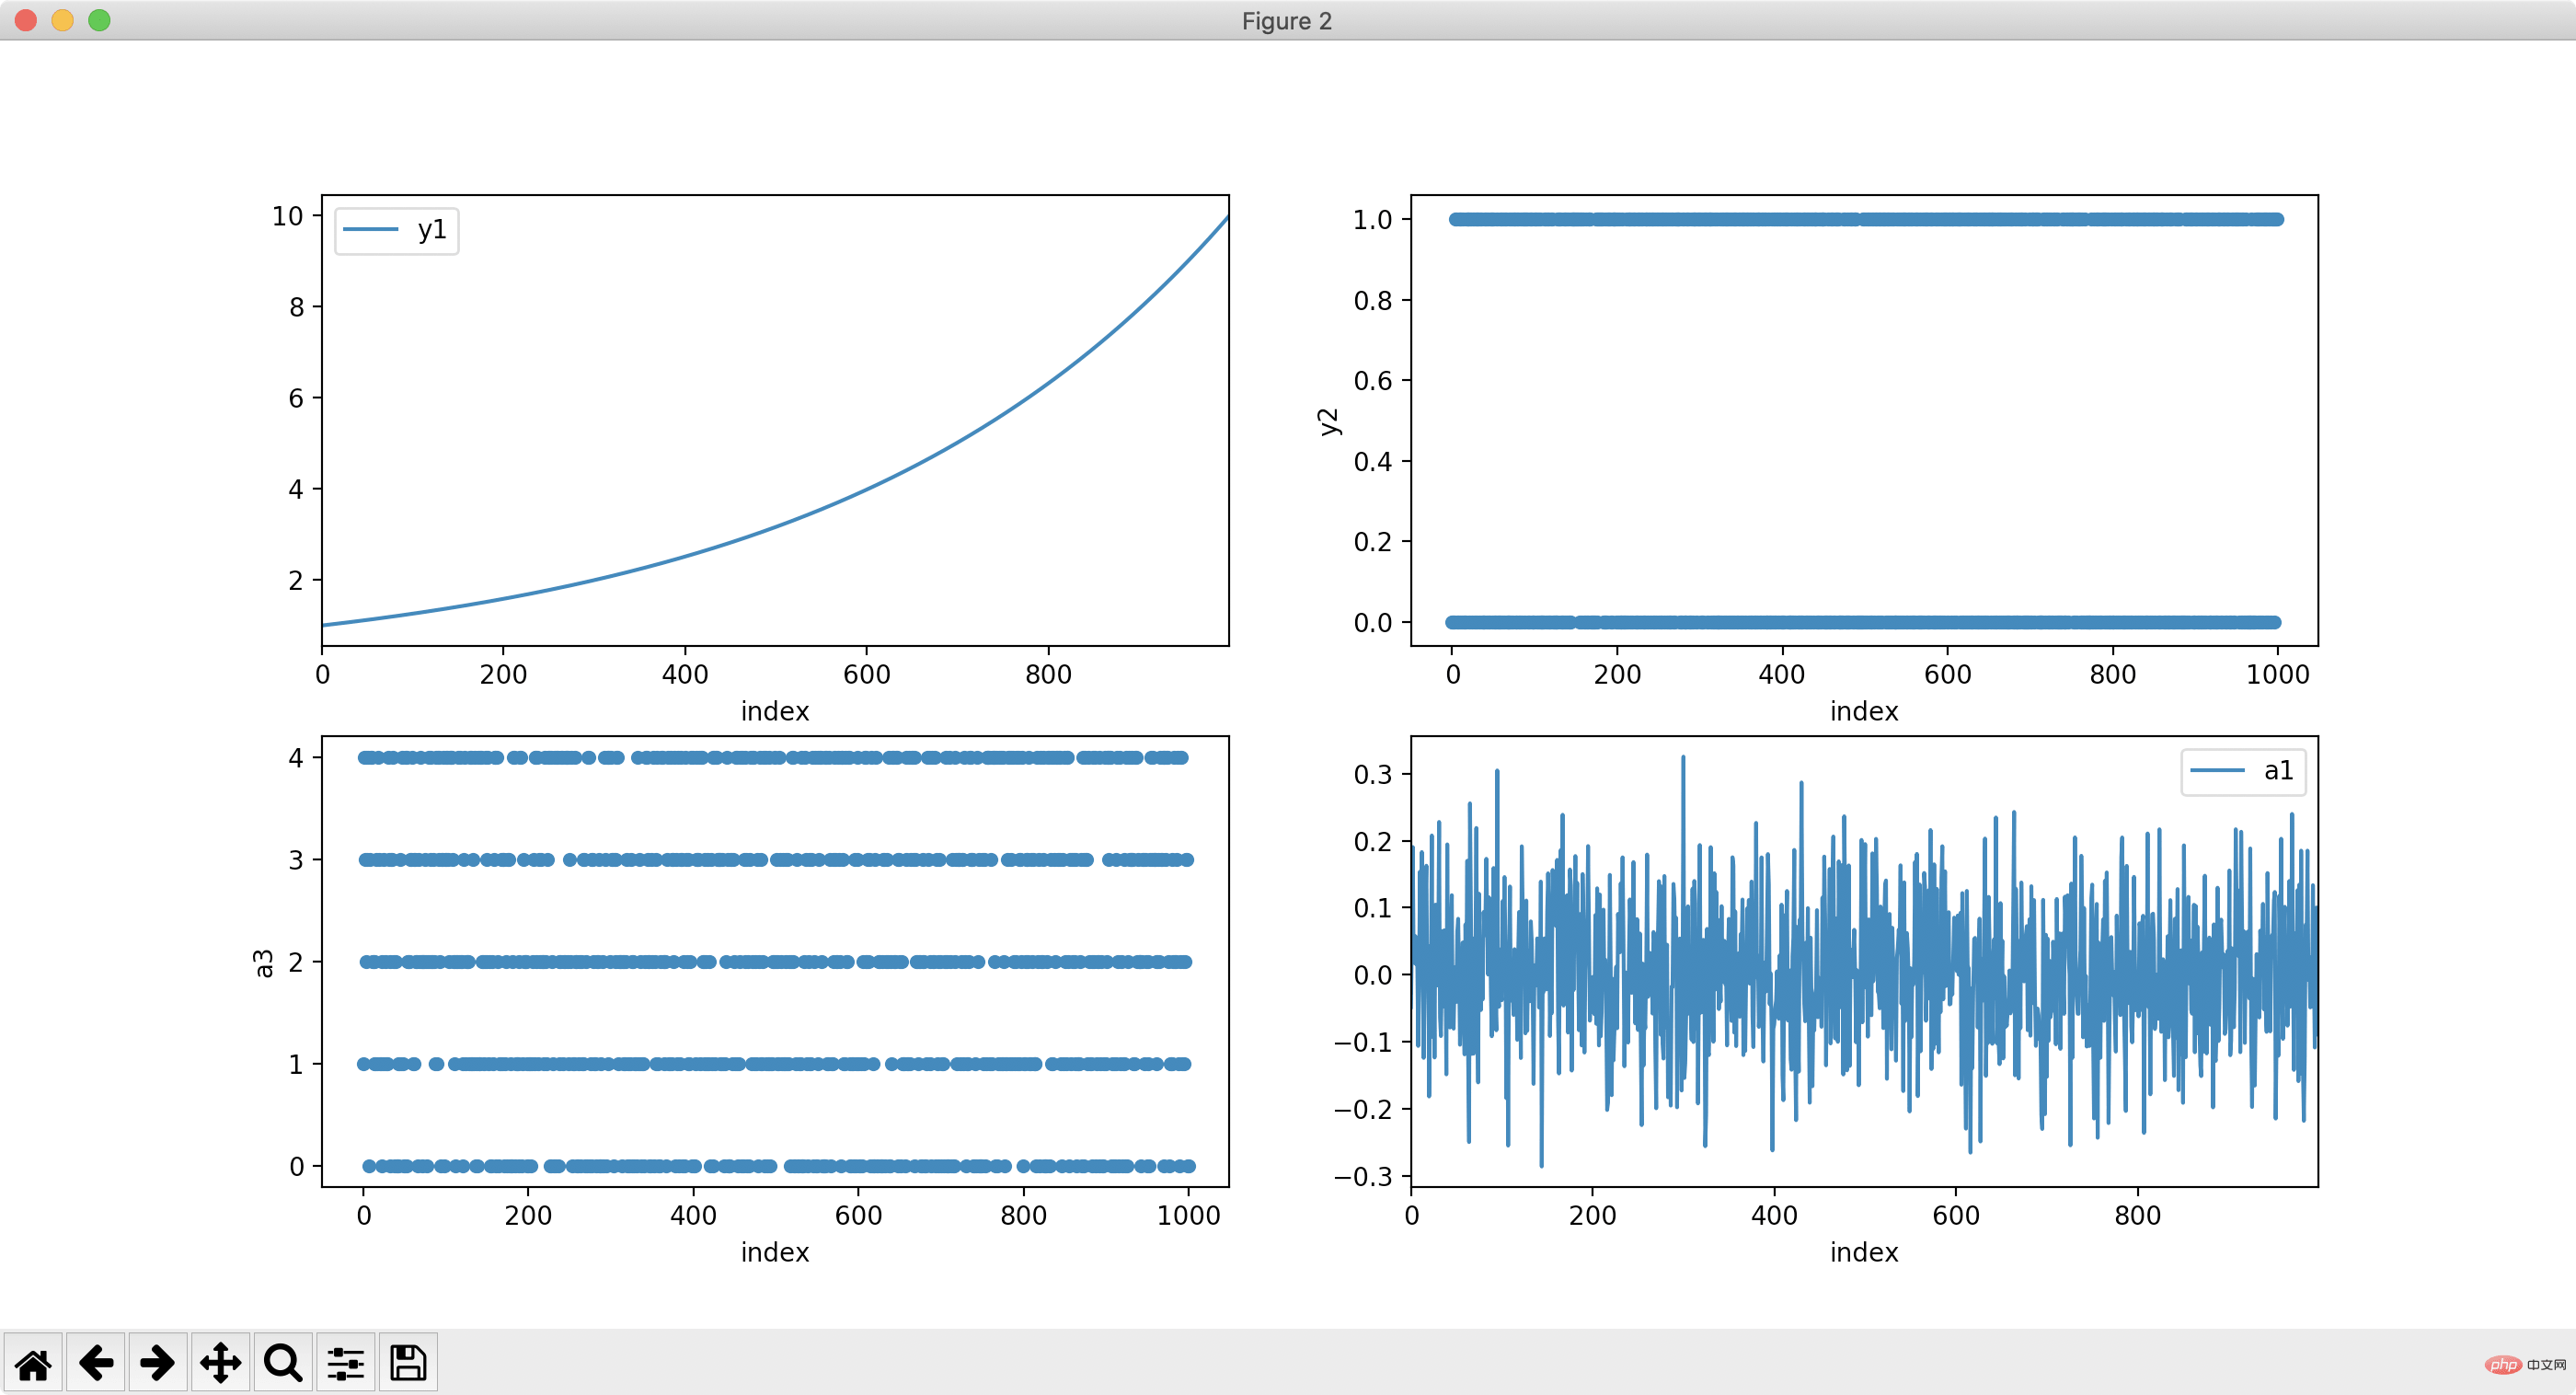
我们还可以自定义一张图上显示多少个表:
1 2 3 4 5 6 | fig, ax = plt.subplots(2, 2, figsize=(14,7))
df.plot(x="index", y="y1", ax=ax[0, 0])
df.plot.scatter(x="index", y="y2", ax=ax[0, 1])
df.plot.scatter(x="index", y="a3", ax=ax[1, 0])
df.plot(x="index", y="a1", ax=ax[1, 1])
plt.show()
|
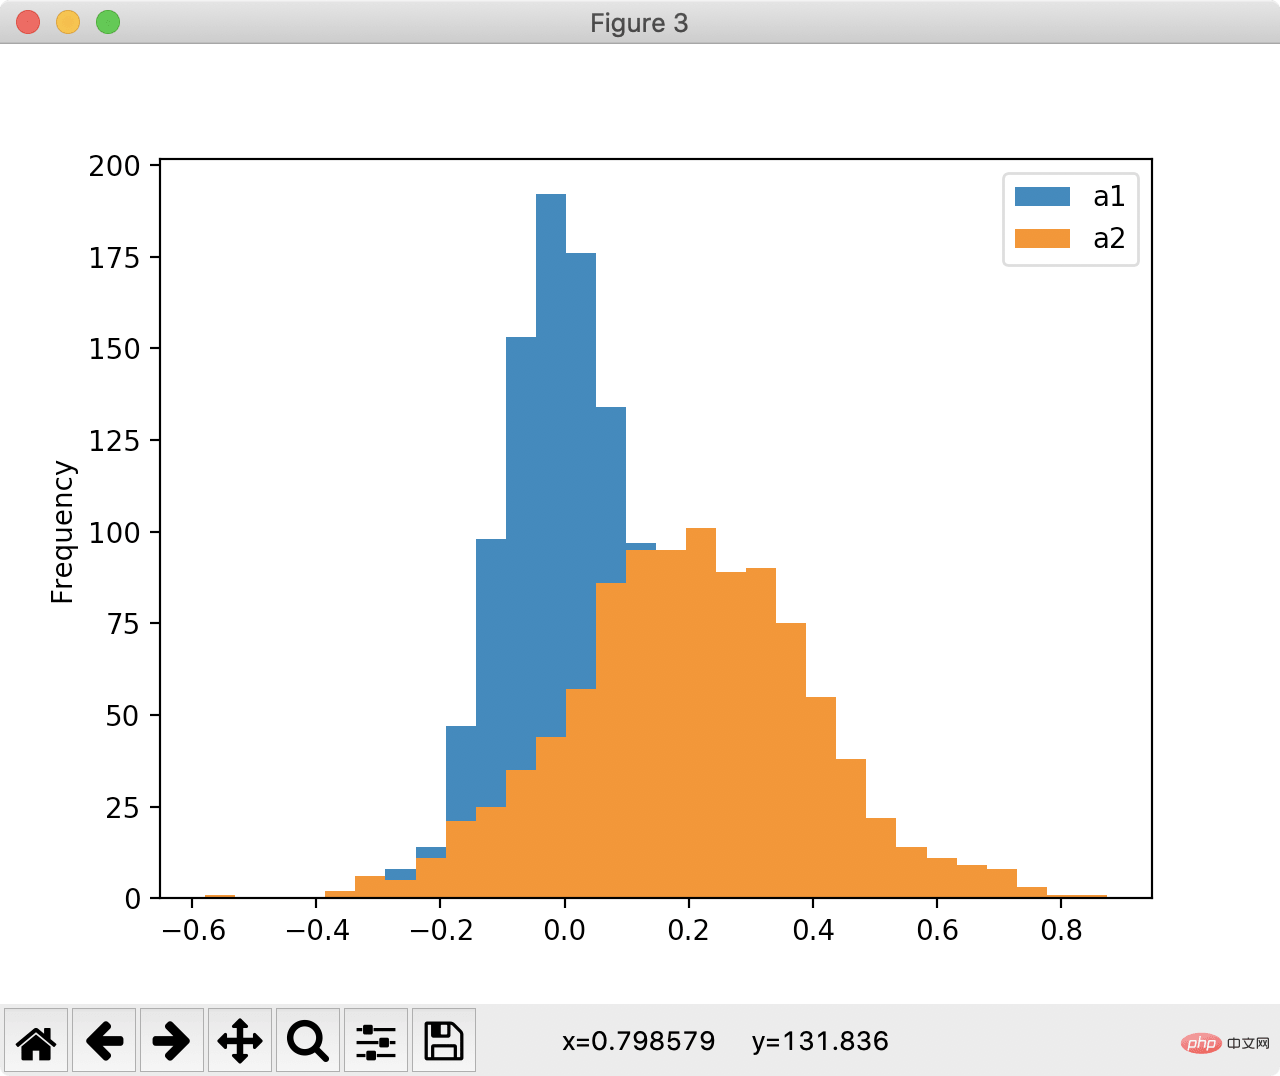
3.绘制直方图
Pandas能够让我们用非常简单的方式获得两个图形的形状对比:
1 2 | df[["a1", "a2"]].plot(bins=30, kind="hist")
plt.show()
|
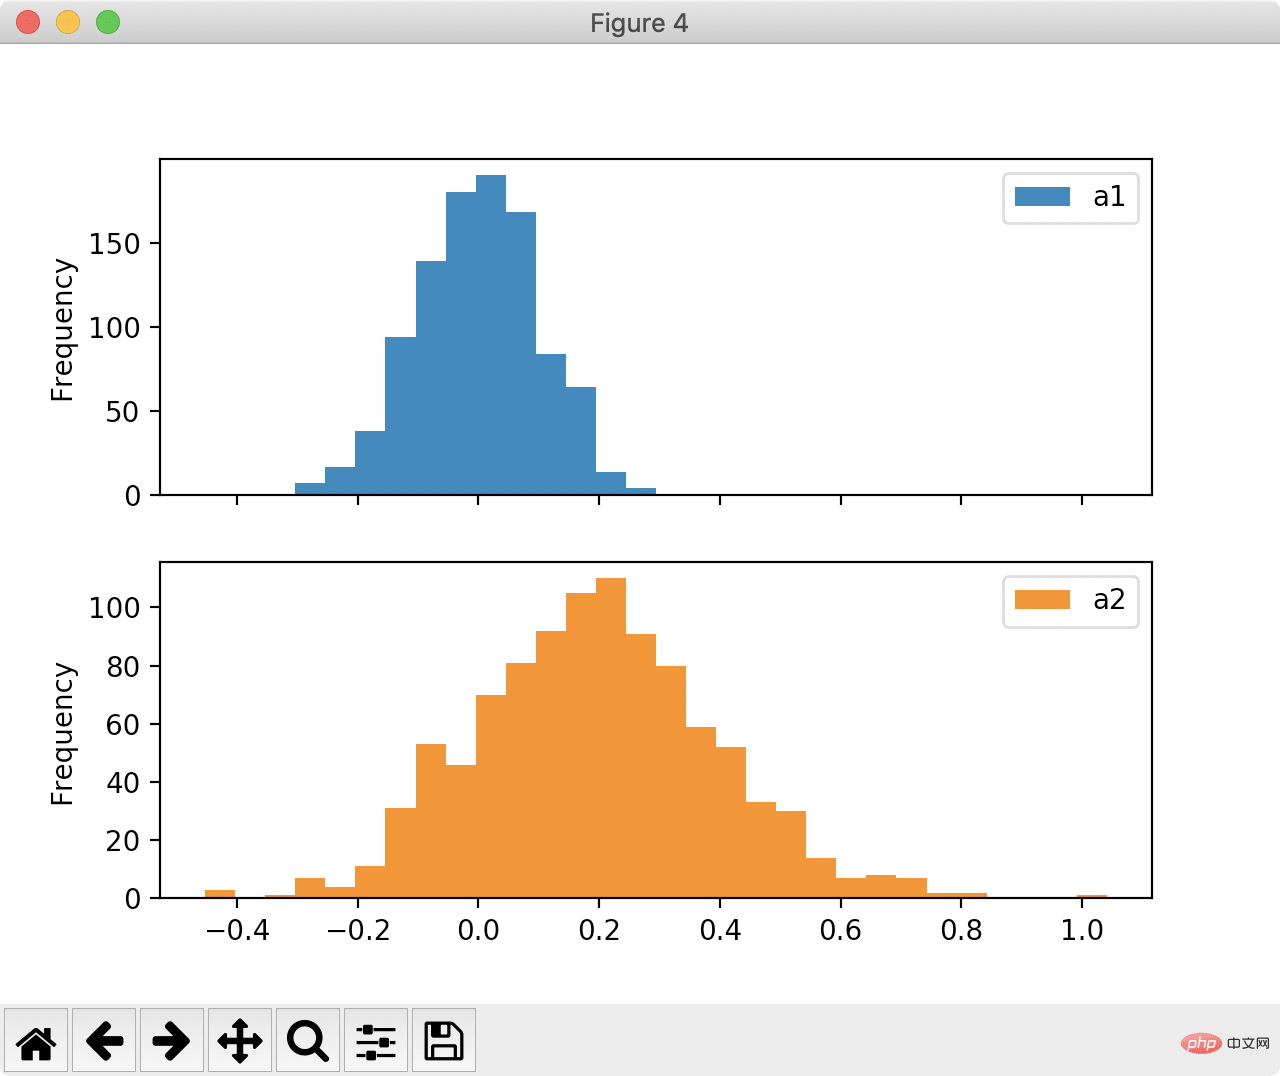
还能允许多图绘制:
1 2 | df[["a1", "a2"]].plot(bins=30, kind="hist", subplots=True)
plt.show()
|
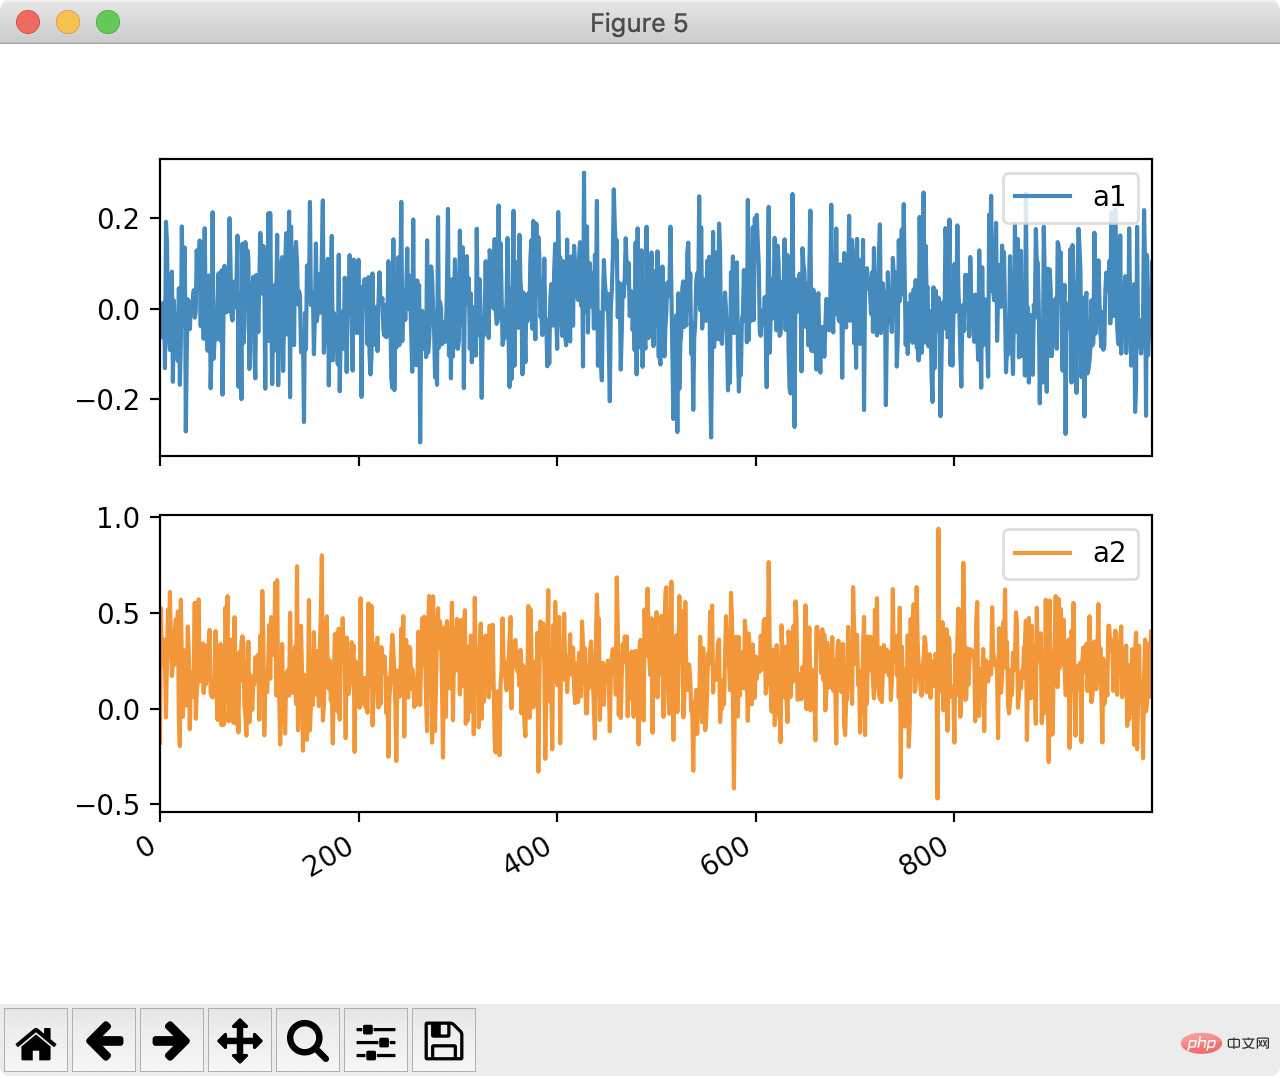
当然,生成折线图也不在画下:
1 2 | df[['a1', 'a2']].plot(by=df.y2, subplots=True)
plt.show()
|
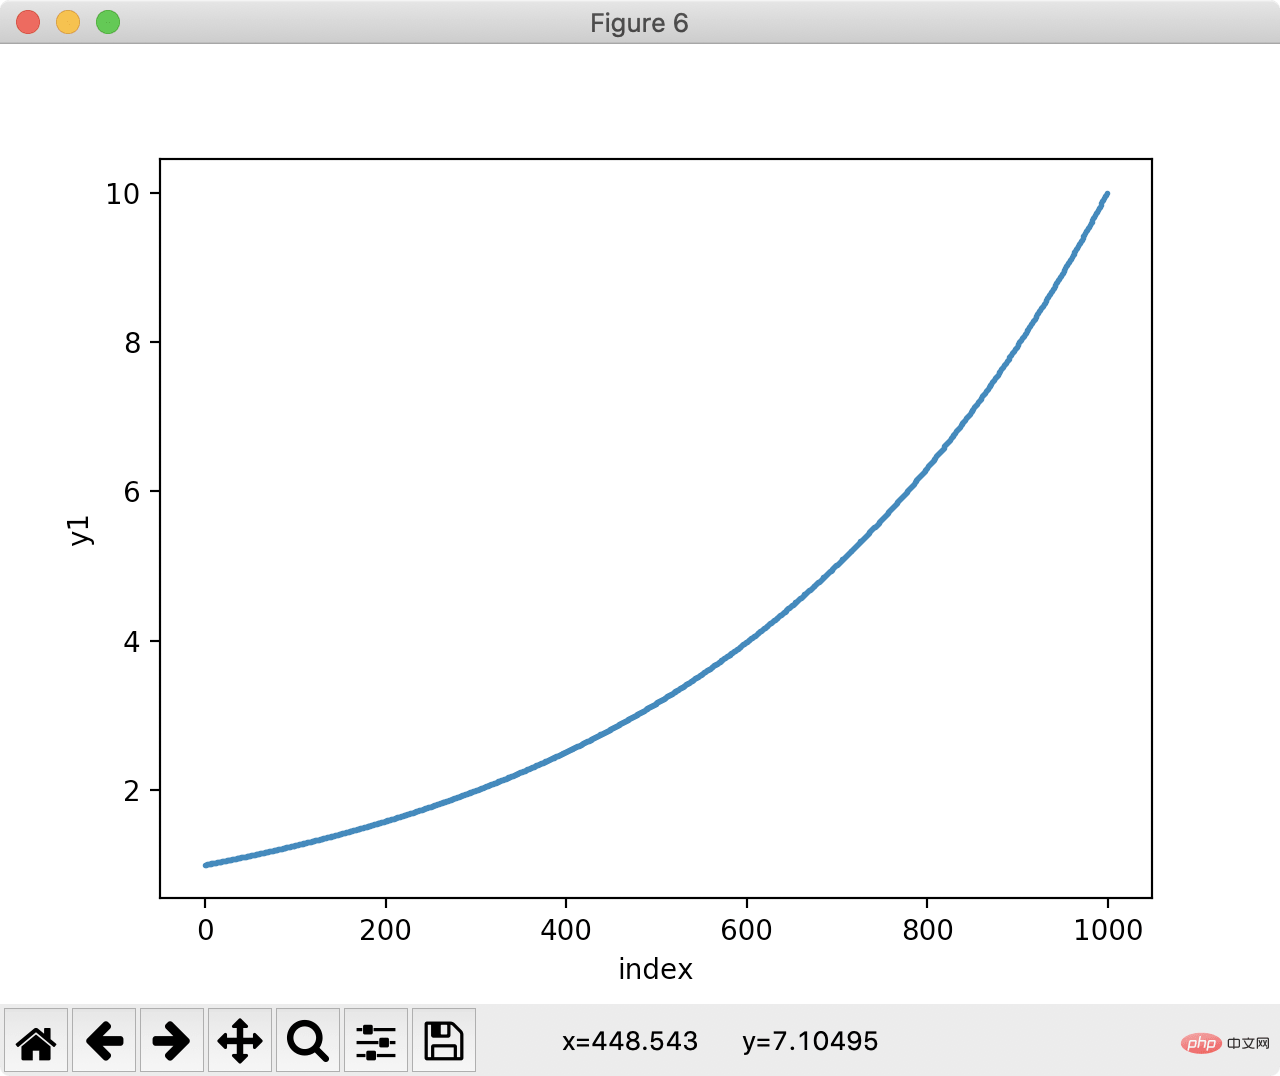
4.线性拟合
Pandas还能用于拟合,让我们用pandas找出一条与下图最接近的直线:
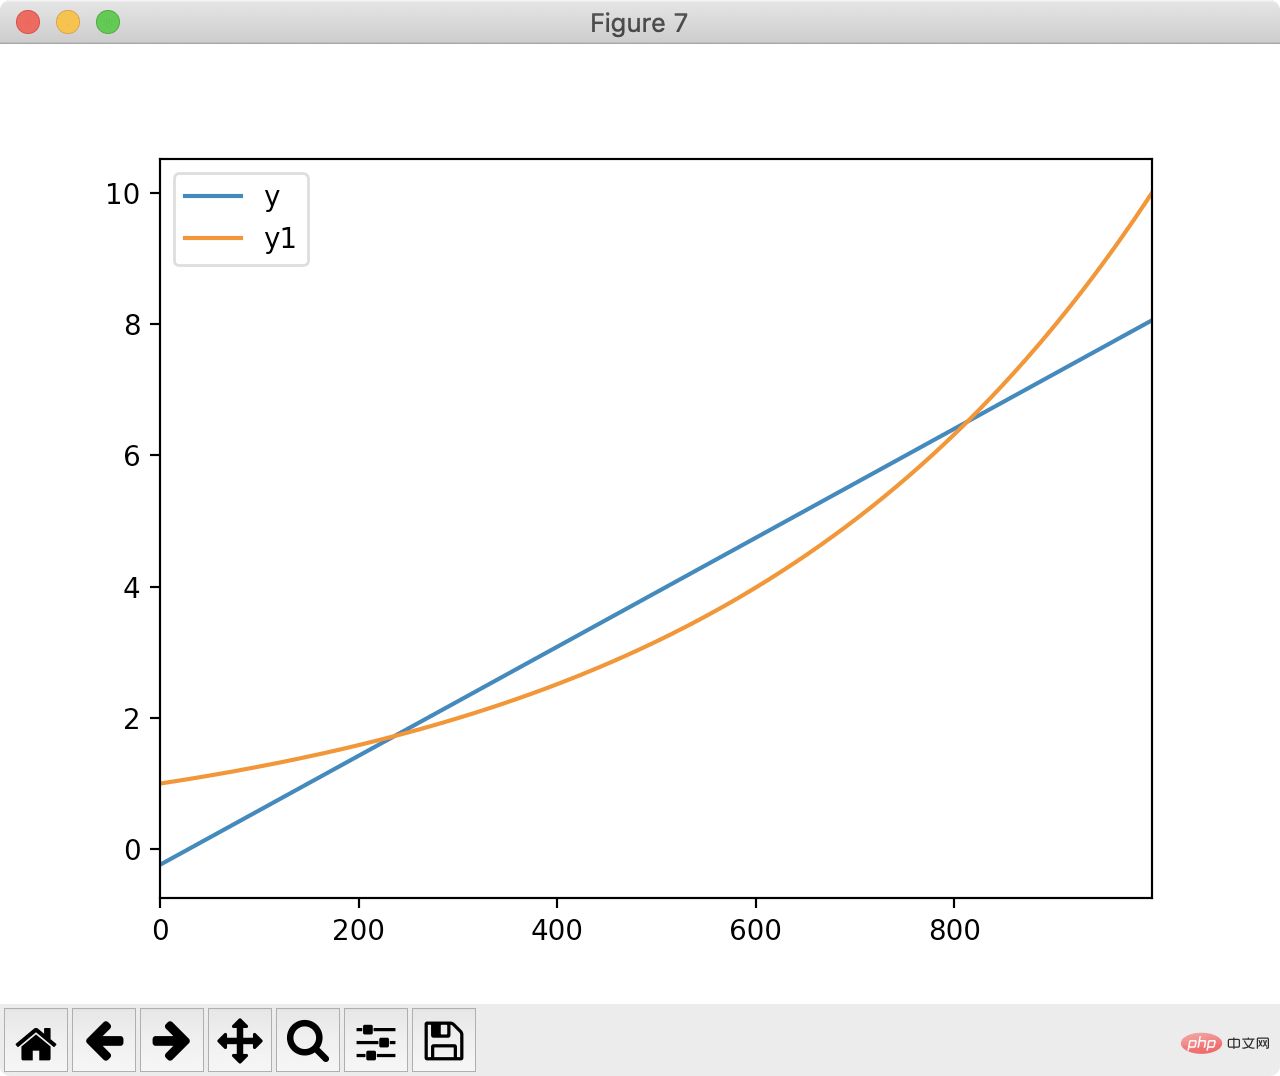
最小二乘法计算和该直线最短距离:
1 2 | df['ones'] = pd.np.ones(len(df))
m, c = pd.np.linalg.lstsq(df[['index', 'ones']], df['y1'], rcond=None)[0]
|
根据最小二乘的结果绘制y和拟合出来的直线:
1 2 3 | df['y'] = df['index'].apply(lambda x: x * m + c)
df[['y', 'y1']].plot()
plt.show()
|
感谢大家的阅读,希望大家收益多多。
本文转自:https://blog.csdn.net/u010751000/article/details/106735872
推荐教程:《python教程》
以上就是值得一看的Python高效数据处理的详细内容,更多文章请关注木庄网络博客!!
返回前面的内容
相关阅读 >>
Python 文件夹遍历和文件查找的实例
安装Python怎么添加环境变量
Python函数重写怎么理解
如何在Python环境下安装selenium+headless chrome
Python如何安装包vtk
Python的format什么意思
Python创建于英国吗
Python中数据类型时间的介绍(附代码)
Python中函数的全面总结(附实例)
Python函数有哪些?
更多相关阅读请进入《Python》频道 >>

人民邮电出版社
python入门书籍,非常畅销,超高好评,python官方公认好书。
转载请注明出处:木庄网络博客 » 值得一看的Python高效数据处理


