python+pandas分析nginx日志的实例


本文摘自php中文网,作者不言,侵删。

下面为大家分享一篇python+pandas分析nginx日志的实例,具有很好的参考价值,希望对大家有所帮助。一起过来看看吧

需求

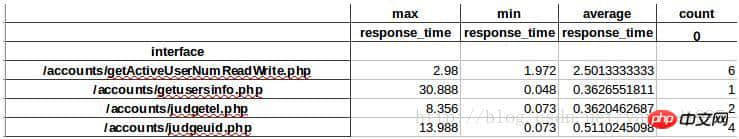
通过分析nginx访问日志,获取每个接口响应时间最大值、最小值、平均值及访问量。

实现原理

将nginx日志uriuriupstream_response_time字段存放到pandas的dataframe中,然后通过分组、数据统计功能实现。

实现

1.准备工作


1

2

3

4

5

6

7

8

#创建日志目录,用于存放日志

mkdir /home/test/python/log/log

#创建文件,用于存放从nginx日志中提取的$uri $upstream_response_time字段

touch /home/test/python/log/log.txt

#安装相关模块

conda create -n science numpy scipy matplotlib pandas

#安装生成execl表格的相关模块

pip install xlwt


2.代码实现


1

2

3

4

5

6

7

8

9

10

11

12

13

14

15

16

17

18

19

20

21

22

23

24

25

26

27

28

29

30

31

32

33

34

35

36

37

38

39

40

41

42

43

44

45

46

47

48

49

50

51

52

53

54

55

56

57

58

#!/usr/local/miniconda2/envs/science/bin/python

#-*- coding: utf-8 -*-

#统计每个接口的响应时间

#请提前创建log.txt并设置logdir

import sys

import os

import pandas as pd

mulu=os.path.dirname(__file__)

#日志文件存放路径

logdir="/home/test/python/log/log"

#存放统计所需的日志相关字段

logfile_format=os.path.join(mulu,"log.txt")

print "read from logfile \n"

for eachfile in os.listdir(logdir):

 logfile=os.path.join(logdir,eachfile)

 with open(logfile, 'r') as fo:

  for line in fo:

   spline=line.split()

   #过滤字段中异常部分

   if spline[6]=="-":

    pass

   elif spline[6]=="GET":

    pass

   elif spline[-1]=="-":

    pass

   else:

    with open(logfile_format, 'a') as fw:

     fw.write(spline[6])

     fw.write('\t')

     fw.write(spline[-1])

     fw.write('\n')

print "output panda"

#将统计的字段读入到dataframe中

reader=pd.read_table(logfile_format,sep='\t',engine='python',names=["interface","reponse_time"] ,header=None,iterator=True)

loop=True

chunksize=10000000

chunks=[]

while loop:

 try:

  chunk=reader.get_chunk(chunksize)

  chunks.append(chunk)

 except StopIteration:

  loop=False

  print "Iteration is stopped."

df=pd.concat(chunks)

#df=df.set_index("interface")

#df=df.drop(["GET","-"])

df_groupd=df.groupby('interface')

df_groupd_max=df_groupd.max()

df_groupd_min= df_groupd.min()

df_groupd_mean= df_groupd.mean()

df_groupd_size= df_groupd.size()

#print df_groupd_max

#print df_groupd_min

#print df_groupd_mean

df_ana=pd.concat([df_groupd_max,df_groupd_min,df_groupd_mean,df_groupd_size],axis=1,keys=["max","min","average","count"])

print "output excel"

df_ana.to_excel("test.xls")


3.打印的表格如下:

要点

1. 日志文件比较大的情况下读取不要用readlines()、readline(),会将日志全部读到内存,导致内存占满。因此在此使用for line in fo迭代的方式,基本不占内存。

2. 读取nginx日志,可以使用pd.read_table(log_file, sep=' ‘, iterator=True),但是此处我们设置的sep无法正常匹配分割,因此先将nginx用split分割,然后再存入pandas。

3. Pandas提供了IO工具可以将大文件分块读取,使用不同分块大小来读取再调用 pandas.concat 连接DataFrame

相关推荐:

python3 pandas 读取MySQL数据和插入


以上就是python+pandas分析nginx日志的实例的详细内容,更多文章请关注木庄网络博客!!

相关阅读 >>

Python语言描述最大连续子序列和

Python使用缩进来体现代码之间的逻辑关系吗?

解决爬虫出现403问题的办法

数据分析师为什么要学Python

Python abs是什么意思?abs函数有什么用处?

如何获取Python中的对象属性?(实例讲解)

numpy掩码式数组详解

Python怎么做大数据分析

Python的变量和变量之间如何实现乘法运算

Python如何将名称映射到序列的元素中(代码)

更多相关阅读请进入《Python》频道 >>


打赏

取消

感谢您的支持,我会继续努力的!

扫码支持
扫码打赏,您说多少就多少

打开支付宝扫一扫,即可进行扫码打赏哦

分享从这里开始,精彩与您同在

评论

管理员已关闭评论功能...