1 2 3 4 5 6 7 8 9 |
|
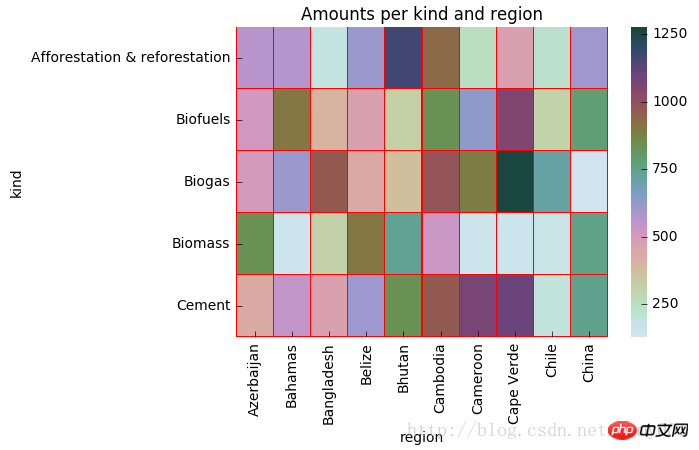
热力图矩阵块之间间隔及间隔线参数
1 2 3 4 5 6 7 |
|
1 2 3 4 5 6 7 8 9 10 11 |
|
1 2 3 4 5 6 7 8 9 10 11 12 13 14 15 |
|
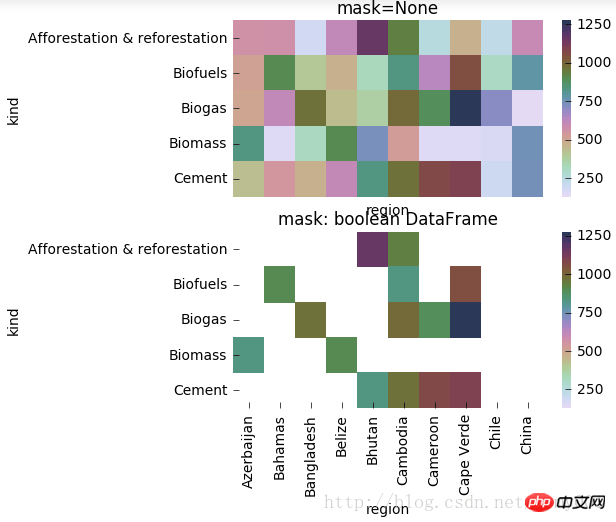
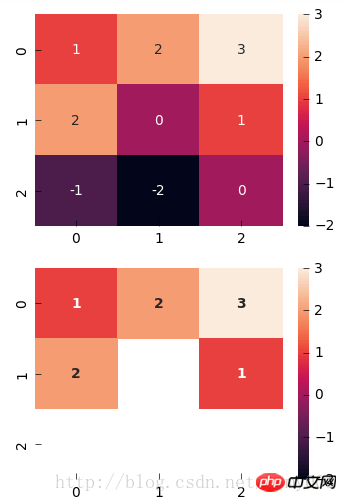
用mask实现:突出显示某些数据
1 2 3 4 |
|
以上就是python如何实现可视化热力图的详细内容,更多文章请关注木庄网络博客!!
相关阅读 >>
更多相关阅读请进入《Python》频道 >>

Python编程 从入门到实践 第2版
python入门书籍,非常畅销,超高好评,python官方公认好书。


