本文摘自php中文网,作者零到壹度,侵删。
这篇文章主要介绍了python如何实现可视化热力图,小编觉得挺不错的,现在分享给大家,也给大家做个参考。一起跟随小编过来看看吧 热力图 1、利用热力图可以看数据表里多个特征两两的相似度。参考官方API参数及地址: seaborn.heatmap(data, vmin=None, vmax=None,cmap=None, center=None, robust=False, annot=None, fmt=’.2g’, annot_kws=None,linewidths=0, linecolor=’white’, cbar=True, cbar_kws=None, cbar_ax=None,square=False, xticklabels=’auto’, yticklabels=’auto’, mask=None, ax=None,**kwargs)
(1)热力图输入数据参数: data :矩阵数据集,可以是numpy的数组(array),也可以是pandas的DataFrame。如果是DataFrame,则df的index/column信息会分别对应到heatmap的columns和rows,即pt.index是热力图的行标,pt.columns是热力图的列标
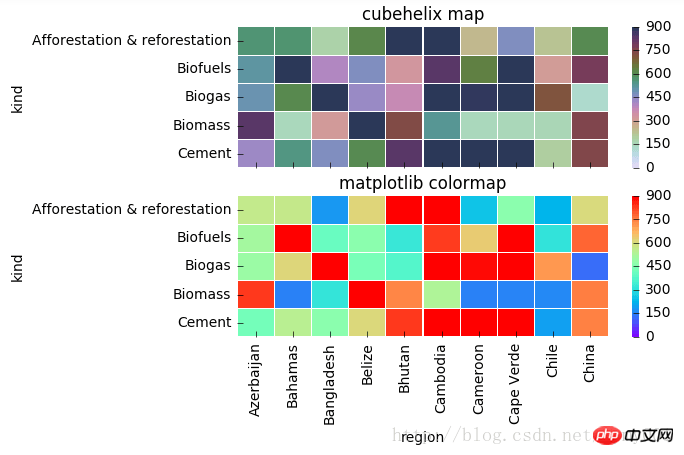
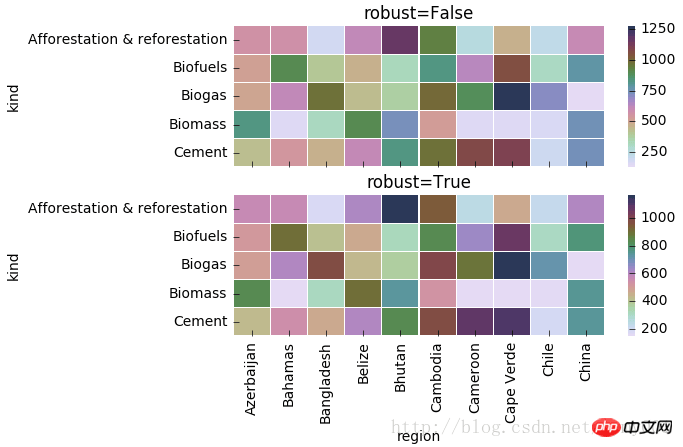
(2)热力图矩阵块颜色参数: vmax,vmin :分别是热力图的颜色取值最大和最小范围,默认是根据data数据表里的取值确定 cmap :从数字到色彩空间的映射,取值是matplotlib包里的colormap名称或颜色对象,或者表示颜色的列表;改参数默认值:根据center参数设定 center :数据表取值有差异时,设置热力图的色彩中心对齐值;通过设置center值,可以调整生成的图像颜色的整体深浅;设置center数据时,如果有数据溢出,则手动设置的vmax、vmin会自动改变 robust :默认取值False;如果是False,且没设定vmin和vmax的值,热力图的颜色映射范围根据具有鲁棒性的分位数设定,而不是用极值设定
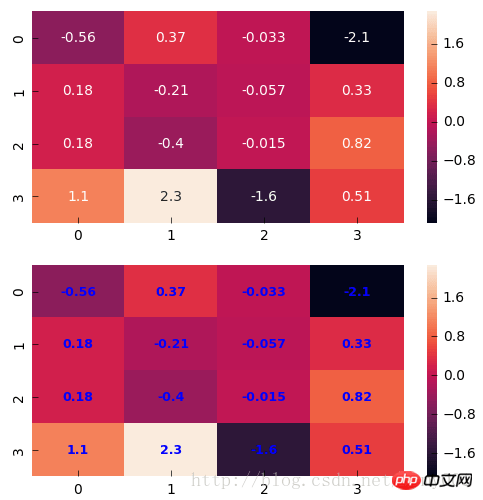
(3)热力图矩阵块注释参数: annot(annotate的缩写) :默认取值False;如果是True,在热力图每个方格写入数据;如果是矩阵,在热力图每个方格写入该矩阵对应位置数据 fmt :字符串格式代码,矩阵上标识数字的数据格式,比如保留小数点后几位数字 annot_kws :默认取值False;如果是True,设置热力图矩阵上数字的大小颜色字体,matplotlib包text类下的字体设置;官方文档:
(4)热力图矩阵块之间间隔及间隔线参数: linewidths :定义热力图里“表示两两特征关系的矩阵小块”之间的间隔大小 linecolor :切分热力图上每个矩阵小块的线的颜色,默认值是’white’
(5)热力图颜色刻度条参数: cbar :是否在热力图侧边绘制颜色刻度条,默认值是True cbar_kws :热力图侧边绘制颜色刻度条时,相关字体设置,默认值是None cbar_ax :热力图侧边绘制颜色刻度条时,刻度条位置设置,默认值是None
(6)square :设置热力图矩阵小块形状,默认值是Falsexticklabels, yticklabels :xticklabels控制每列标签名的输出;yticklabels控制每行标签名的输出。默认值是auto。如果是True,则以DataFrame的列名作为标签名。如果是False,则不添加行标签名。如果是列表,则标签名改为列表中给的内容。如果是整数K,则在图上每隔K个标签进行一次标注。 如果是auto,则自动选择标签的标注间距,将标签名不重叠的部分(或全部)输出 mask :控制某个矩阵块是否显示出来。默认值是None。如果是布尔型的DataFrame,则将DataFrame里True的位置用白色覆盖掉 ax :设置作图的坐标轴,一般画多个子图时需要修改不同的子图的该值 **kwargs :All other keyword arguments are passed to ax.pcolormesh
热力图矩阵块颜色参数 1
2
3
4
5
6
7
8
9
10
11
12
13
14
15
16
17
18
19
20
21
#cmap(颜色)
import matplotlib.pyplot as plt
% matplotlib inline
f, (ax1,ax2) = plt.subplots(figsize = (6,4),nrows=2)
# cmap用cubehelix map颜色
cmap = sns.cubehelix_palette(start = 1.5, rot = 3, gamma=0.8, as_cmap = True)
sns.heatmap(pt, linewidths = 0.05, ax = ax1, vmax=900, vmin=0, cmap=cmap)
ax1.set_title('cubehelix map')
ax1.set_xlabel('')
ax1.set_xticklabels([]) #设置x轴图例为空值
ax1.set_ylabel('kind')
# cmap用matplotlib colormap
sns.heatmap(pt, linewidths = 0.05, ax = ax2, vmax=900, vmin=0, cmap='rainbow')
# rainbow为 matplotlib 的colormap名称
ax2.set_title('matplotlib colormap')
ax2.set_xlabel('region')
ax2.set_ylabel('kind')
1
2
3
4
5
6
7
8
9
10
#center的用法(颜色)f, (ax1,ax2) = plt.subplots(figsize = (6, 4),nrows=2)
cmap = sns.cubehelix_palette(start = 1.5, rot = 3, gamma=0.8, as_cmap = True)
sns.heatmap(pt, linewidths = 0.05, ax = ax1, cmap=cmap, center=None )
ax1.set_title('center=None')
ax1.set_xlabel('')
ax1.set_xticklabels([]) #设置x轴图例为空值ax1.set_ylabel('kind')# 当center设置小于数据的均值时,生成的图片颜色要向0值代表的颜色一段偏移sns.heatmap(pt, linewidths = 0.05, ax = ax2, cmap=cmap, center=200)
ax2.set_title('center=3000')
ax2.set_xlabel('region')
ax2.set_ylabel('kind')
1
2
3
4
5
6
7
8
9
10
11
12
13
#robust的用法(颜色)f, (ax1,ax2) = plt.subplots(figsize = (6,4),nrows=2)
cmap = sns.cubehelix_palette(start = 1.5, rot = 3, gamma=0.8, as_cmap = True)
sns.heatmap(pt, linewidths = 0.05, ax = ax1, cmap=cmap, center=None, robust=False )
ax1.set_title('robust=False')
ax1.set_xlabel('')
ax1.set_xticklabels([]) #设置x轴图例为空值ax1.set_ylabel('kind')
sns.heatmap(pt, linewidths = 0.05, ax = ax2, cmap=cmap, center=None, robust=True )
ax2.set_title('robust=True')
ax2.set_xlabel('region')
ax2.set_ylabel('kind')
热力图矩阵块注释参数 1
2
3
4
5
6
7
8
9
#annot(矩阵上数字),annot_kws(矩阵上数字的大小颜色字体)matplotlib包text类下的字体设置import numpy as np
np.random.seed(20180316)
x = np.random.randn(4, 4)
f, (ax1, ax2) = plt.subplots(figsize=(6,6),nrows=2)
sns.heatmap(x, annot=True, ax=ax1)
sns.heatmap(x, annot=True, ax=ax2, annot_kws={'size':9,'weight':'bold', 'color':'blue'})# Keyword arguments for ax.text when annot is True. http:
相关阅读 >>
如何查找当前目录和文件目录
【Python 学习】pycharm超实用使用教程
Python 会取代java吗
Python 中关于try-except用法的错误和异常处理详解
Python 面向对象编程中类和实例的简单讲解(附示例)
Python 线程下thread对象的用法介绍(附实例)
Python 编译器和解释器的区别
Python 如何合并两个字典?(代码示例)
Python 中导入模块中的对象有哪几种方式
Python 怎么导入math库?
更多相关阅读请进入《Python 》频道 >>
¥69.8元
python入门书籍,非常畅销,超高好评,python官方公认好书。
转载请注明出处:木庄网络博客 » python如何实现可视化热力图