本文摘自php中文网,作者PHP中文网,侵删。
1.环境系统:windows10
python版本:python3.6.1
使用的库:matplotlib,numpy
2.numpy库产生随机数几种方法
import numpy as npnumpy.random
rand(d0, d1, ..., dn) In [2]: x=np.random.rand(2,5)
In [3]: x
Out[3]:
array([[ 0.84286554, 0.50007593, 0.66500549, 0.97387807, 0.03993009],
[ 0.46391661, 0.50717355, 0.21527461, 0.92692517, 0.2567891 ]])randn(d0, d1, ..., dn)查询结果为标准正态分布
In [4]: x=np.random.randn(2,5)
In [5]: x
Out[5]:
array([[-0.77195196, 0.26651203, -0.35045793, -0.0210377 , 0.89749635],
[-0.20229338, 1.44852833, -0.10858996, -1.65034606, -0.39793635]])randint(low,high,size) 生成low到high之间(半开区间 [low, high)),size个数据
In [6]: x=np.random.randint(1,8,4)
In [7]: x
Out[7]: array([4, 4, 2, 7])random_integers(low,high,size) 生成low到high之间(闭区间 [low, high)),size个数据
In [10]: x=np.random.random_integers(2,10,5)
In [11]: x
Out[11]: array([7, 4, 5, 4, 2])
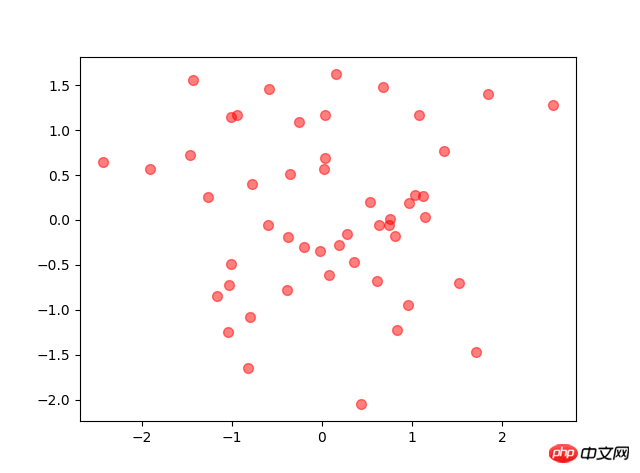
3.散点图
x x轴
y y轴
s   圆点面积
c   颜色
marker  圆点形状
alpha   圆点透明度                #其他图也类似这种配置
N=50# height=np.random.randint(150,180,20)# weight=np.random.randint(80,150,20) x=np.random.randn(N) y=np.random.randn(N) plt.scatter(x,y,s=50,c='r',marker='o',alpha=0.5) plt.show()
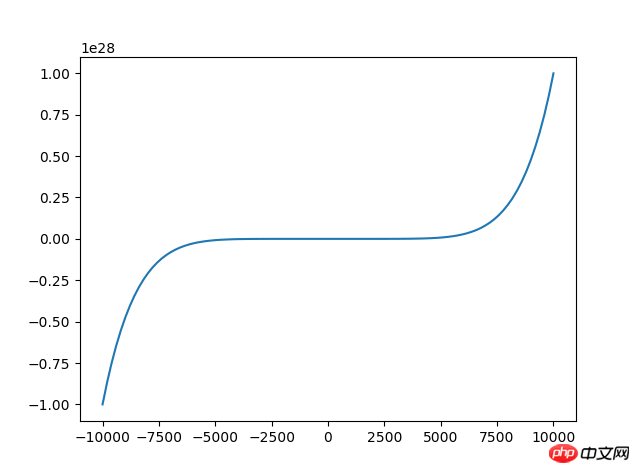
4.折线图
# 来源:百度网盘搜索
x=np.linspace(-10000,10000,100) #将-10到10等区间分成100份
y=x**2+x**3+x**7
plt.plot(x,y)
plt.show()
折线图使用plot函数
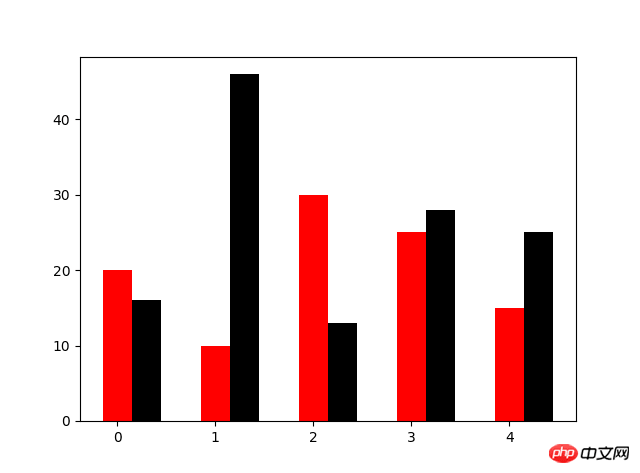
5.条形图
N=5
y=[20,10,30,25,15]
y1=np.random.randint(10,50,5)
x=np.random.randint(10,1000,N)
index=np.arange(N)
plt.bar(left=index,height=y,color='red',width=0.3)
plt.bar(left=index+0.3,height=y1,color='black',width=0.3)
plt.show()
相关阅读 >>
conda install和pip install的区别有哪些?
Python中import 与__import__() 之间的区别比较
rectangle是什么意思,如何利用elipse和rectangle画图
更多相关阅读请进入《Python》频道 >>

书籍 Python编程 从入门到实践 第2版
python入门书籍,非常畅销,超高好评,python官方公认好书。