Python图像处理二值化方法实例云集


本文摘自php中文网,作者coldplay.xixi,侵删。

在用python进行图像处理时,二值化是非常重要的一步,现总结了自己遇到过的6种 图像二值化的方法(当然这个绝对不是全部的二值化方法,若发现新的方法会继续新增)。

相关学习推荐:python视频教程

1. opencv 简单阈值 cv2.threshold

2. opencv 自适应阈值 cv2.adaptiveThreshold (自适应阈值中计算阈值的方法有两种:mean_c 和 guassian_c ,可以尝试用下哪种效果好)

3. Otsu's 二值化

例子:

1

2

3

4

5

6

7

8

9

10

11

12

13

14

15

16

17

18

19

20

21

22

23

24

25

26

27

28

29

30

31

import cv2

import numpy as np

from matplotlib import pyplot as plt


img = cv2.imread('scratch.png', 0)

# global thresholding

ret1, th1 = cv2.threshold(img, 127, 255, cv2.THRESH_BINARY)

# Otsu's thresholding

th2 = cv2.adaptiveThreshold(img, 255, cv2.ADAPTIVE_THRESH_MEAN_C, cv2.THRESH_BINARY, 11, 2)

# Otsu's thresholding

# 阈值一定要设为 0 !

ret3, th3 = cv2.threshold(img, 0, 255, cv2.THRESH_BINARY + cv2.THRESH_OTSU)

# plot all the images and their histograms

images = [img, 0, th1, img, 0, th2, img, 0, th3]

titles = [

  'Original Noisy Image', 'Histogram', 'Global Thresholding (v=127)',

  'Original Noisy Image', 'Histogram', "Adaptive Thresholding",

  'Original Noisy Image', 'Histogram', "Otsu's Thresholding"

]

# 这里使用了 pyplot 中画直方图的方法, plt.hist, 要注意的是它的参数是一维数组

# 所以这里使用了( numpy ) ravel 方法,将多维数组转换成一维,也可以使用 flatten 方法

# ndarray.flat 1-D iterator over an array.

# ndarray.flatten 1-D array copy of the elements of an array in row-major order.

for i in range(3):

  plt.subplot(3, 3, i * 3 + 1), plt.imshow(images[i * 3], 'gray')

  plt.title(titles[i * 3]), plt.xticks([]), plt.yticks([])

  plt.subplot(3, 3, i * 3 + 2), plt.hist(images[i * 3].ravel(), 256)

  plt.title(titles[i * 3 + 1]), plt.xticks([]), plt.yticks([])

  plt.subplot(3, 3, i * 3 + 3), plt.imshow(images[i * 3 + 2], 'gray')

  plt.title(titles[i * 3 + 2]), plt.xticks([]), plt.yticks([])

plt.show()

结果图:

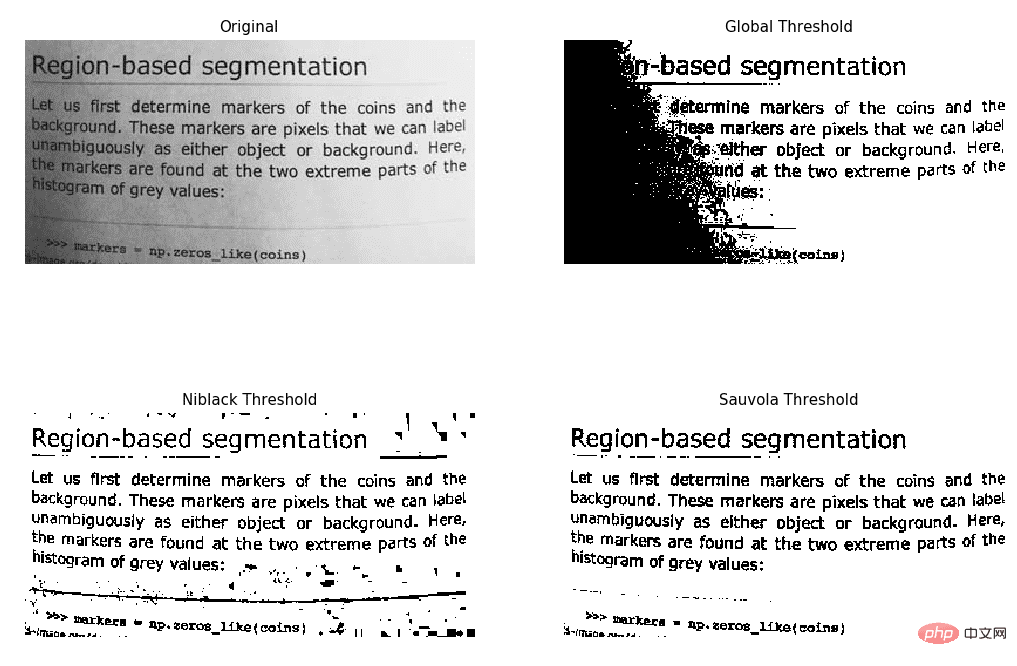
4. skimage niblack阈值

5. skimage sauvola阈值 (主要用于文本检测)

例子:

https://scikit-image.org/docs/dev/auto_examples/segmentation/plot_niblack_sauvola.html

1

2

3

4

5

6

7

8

9

10

11

12

13

14

15

16

17

18

19

20

21

22

23

24

25

26

27

28

29

30

31

32

33

34

35

36

37

38

39

40

41

42

43

import matplotlib

import matplotlib.pyplot as plt


from skimage.data import page

from skimage.filters import (threshold_otsu, threshold_niblack,

               threshold_sauvola)


matplotlib.rcParams['font.size'] = 9


image = page()

binary_global = image > threshold_otsu(image)


window_size = 25

thresh_niblack = threshold_niblack(image, window_size=window_size, k=0.8)

thresh_sauvola = threshold_sauvola(image, window_size=window_size)


binary_niblack = image > thresh_niblack

binary_sauvola = image > thresh_sauvola


plt.figure(figsize=(8, 7))

plt.subplot(2, 2, 1)

plt.imshow(image, cmap=plt.cm.gray)

plt.title('Original')

plt.axis('off')


plt.subplot(2, 2, 2)

plt.title('Global Threshold')

plt.imshow(binary_global, cmap=plt.cm.gray)

plt.axis('off')


plt.subplot(2, 2, 3)

plt.imshow(binary_niblack, cmap=plt.cm.gray)

plt.title('Niblack Threshold')

plt.axis('off')


plt.subplot(2, 2, 4)

plt.imshow(binary_sauvola, cmap=plt.cm.gray)

plt.title('Sauvola Threshold')

plt.axis('off')


plt.show()

结果图:

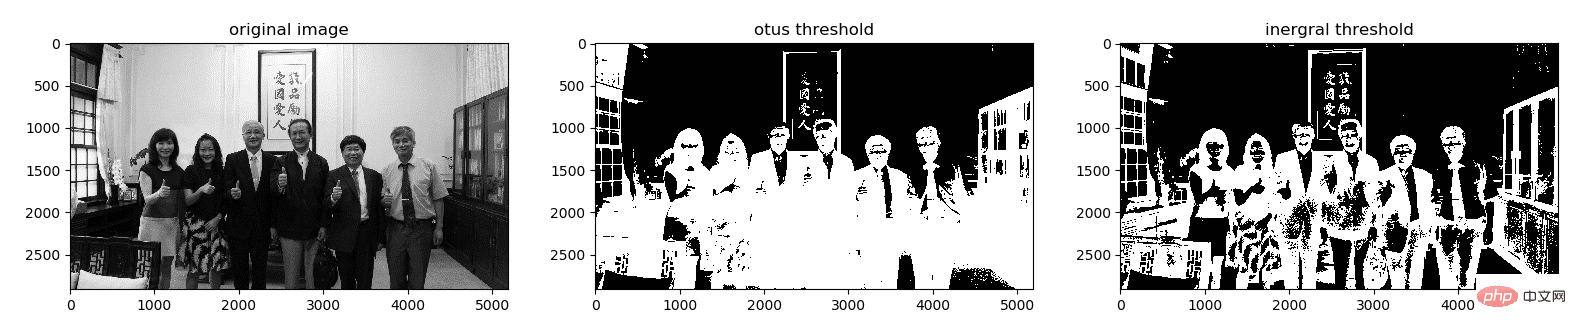
6.IntegralThreshold(主要用于文本检测)

使用方法: 运行下面网址的util.py文件

https://github.com/Liang-yc/IntegralThreshold

结果图:

以上就是Python图像处理二值化方法实例云集的详细内容,更多文章请关注木庄网络博客!!

相关阅读 >>

Python的单线程多任务的实现

Python爬虫入门心得分享

Python 中的selenium异常处理

Python - 写代码时过长该如何解决?

Python结合imagemagick实现多张图片合并为一个pdf文件的方法

详细分析之Python可变对象和不可变对象

如何列出一个目录的所有文件

Python下什么软件

Python中dict是什么

Python文件和流相关知识介绍

更多相关阅读请进入《Python》频道 >>


打赏

取消

感谢您的支持,我会继续努力的!

扫码支持
扫码打赏,您说多少就多少

打开支付宝扫一扫,即可进行扫码打赏哦

分享从这里开始,精彩与您同在

评论

管理员已关闭评论功能...